Trial Results
TLF and TVF At 12-months Follow-up
TLF at 12 Months
TVF at 12 Months
Clinical Outcomes at 12 Months
| Clinical Outcomes | N=5000 Patients |
|---|---|
| Death from any cause | 132 (2.9%) |
| Cardiac death | 69 (1.6%) |
| Target-vessel myocardial infarction | 83 (1.8%) |
| Clinically-driven target lesion revascularization | 95 (2.1%) |
| Target vessel revascularization | 184 (3.8%) |
| Any stent thrombosis | 34 (0.8%) |
| Definite stent thrombosis | 32 (0.7%) |
| Possible stent thrombosis | 2 (0.0%) |
| Target lesion failure | 247 (5.3%) |
| Target vessel failure | 283 (6.0%) |
Conclusion
- The results from the first 5,000 patients in the S-FLEX Netherlands registry show a low incidence of TLF and stent thrombosis at 12 months follow-up in real-world patients.
- Patients with multi-vessel disease, diabetes and octogenarians revealed higher rates of TLF among various subgroups analysed at 12 months follow-up.
- These findings demonstrate the favorable safety and effectiveness of the Supraflex Family of stents in routine clinical practice in the Netherlands.
Additional information
Baseline Characteristics
| Baseline Characteristics | N=5000 |
|---|---|
| Age, Years | 67.37 ± 10.78 |
| Male | 3694 (73.9%) |
| Diabetes Mellitus | 1009 (20.2%) |
| Smoker | 1071 (21.4%) |
| Renal Insufficiency | 164 (3.3%) |
| Ejection Fraction ≤ 35 % | 233 (4.7%) |
| Hypercholesterolemia | 2222 (44.4%) |
| Hypertension | 2667 (53.3%) |
| Peripheral Vascular Disease | 339 (6.8%) |
| Family History of CAD | 1854 (37.1%) |
| Previous Stroke | 149 (3.0%) |
| Transient Ischemic attack | 224 (4.5%) |
| Congestive Heart Failure | 173 (3.5%) |
| Previous Myocardial Infarction | 1057 (21.1%) |
| Previous CABG | 369 (7.4%) |
| Previous PCI | 1316 (26.3%) |
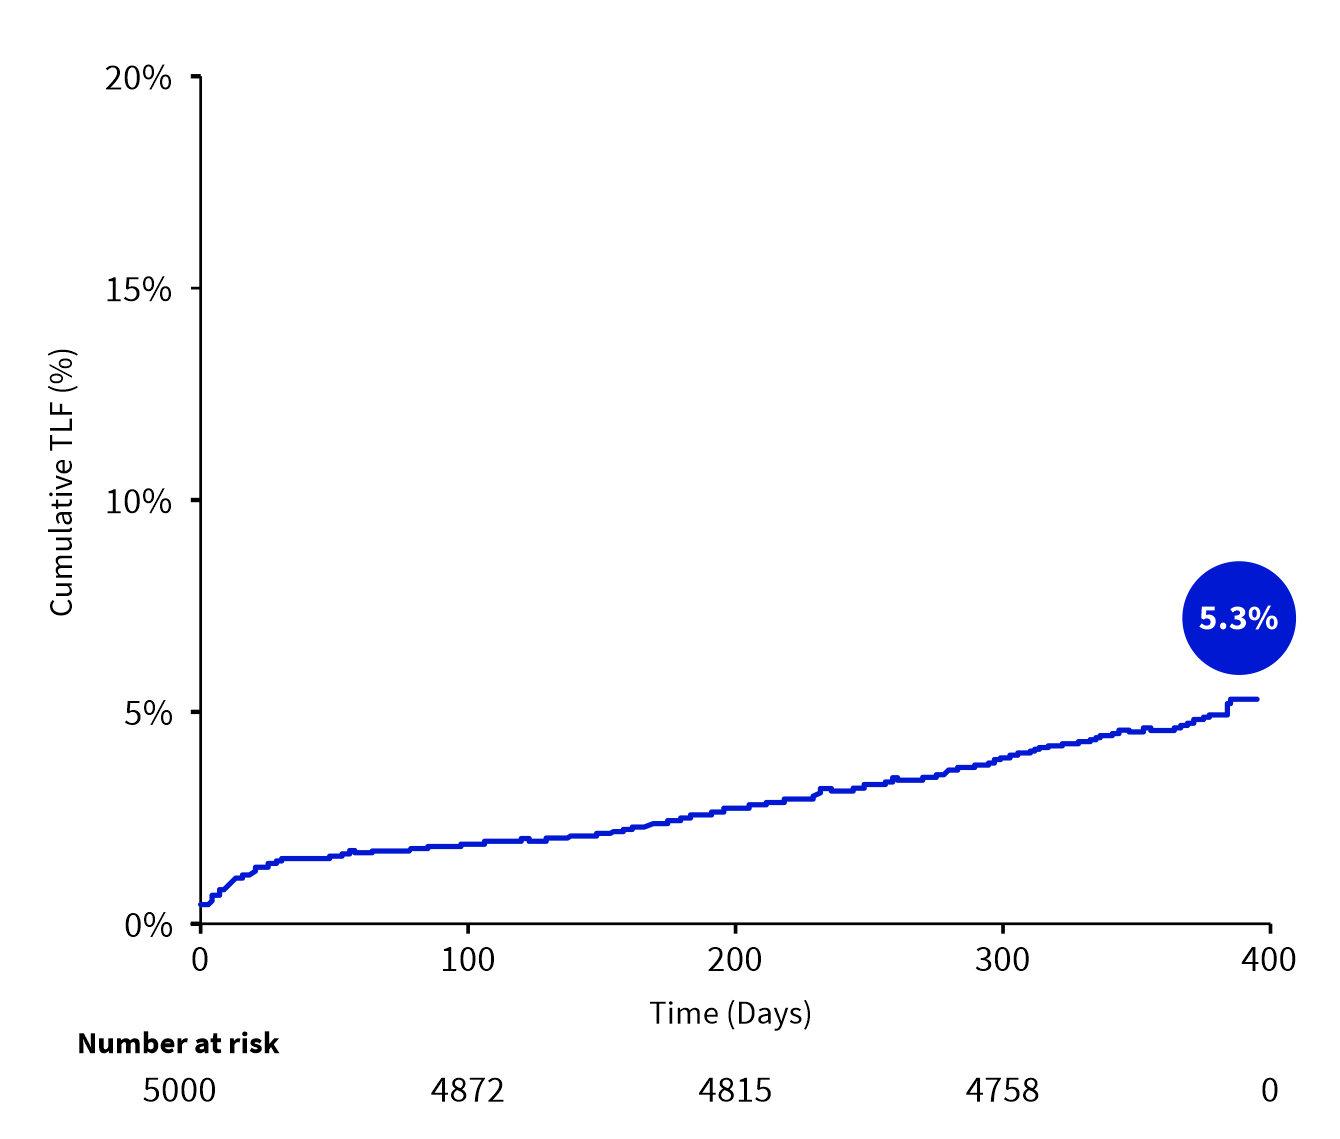
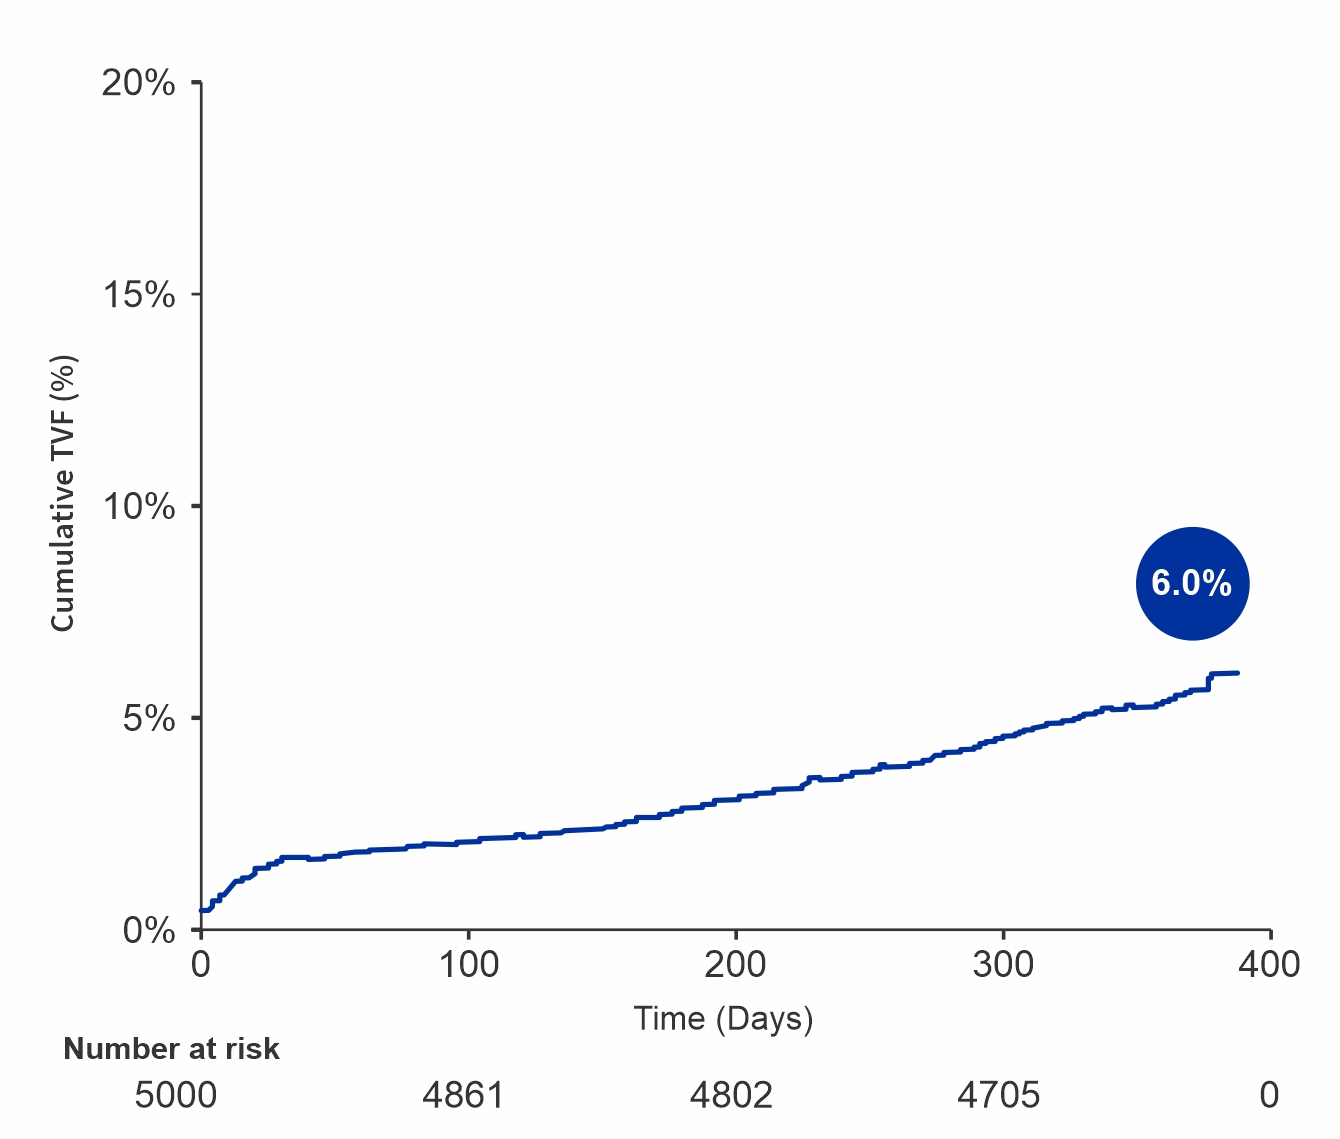
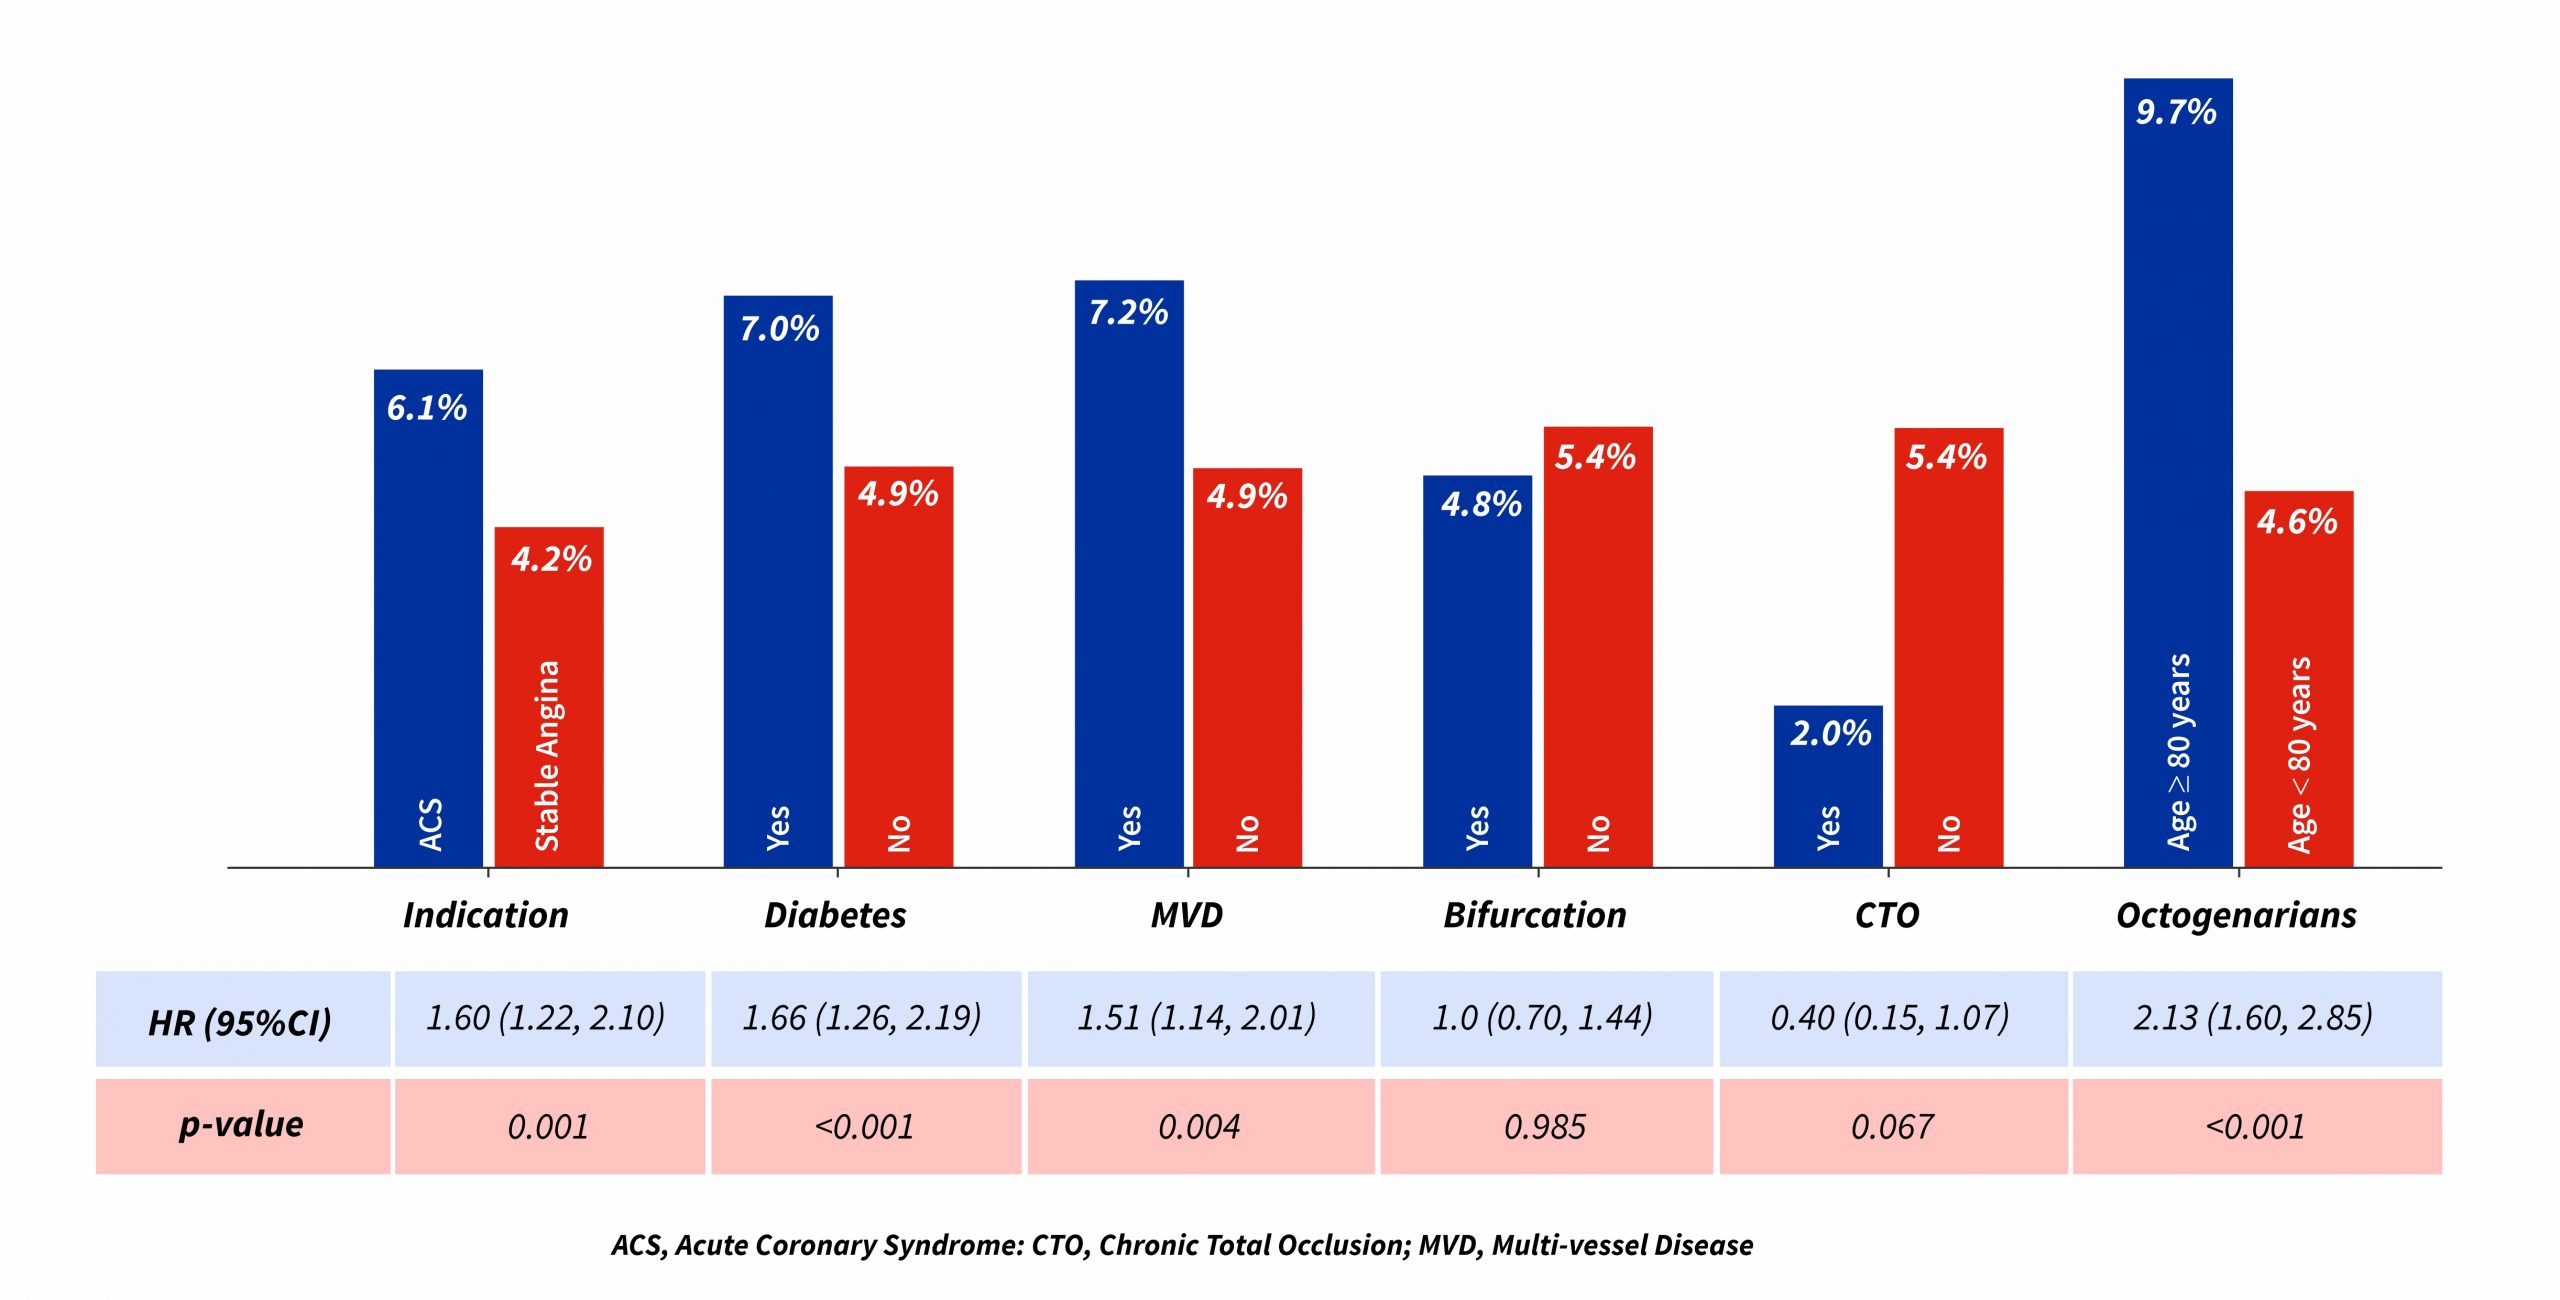
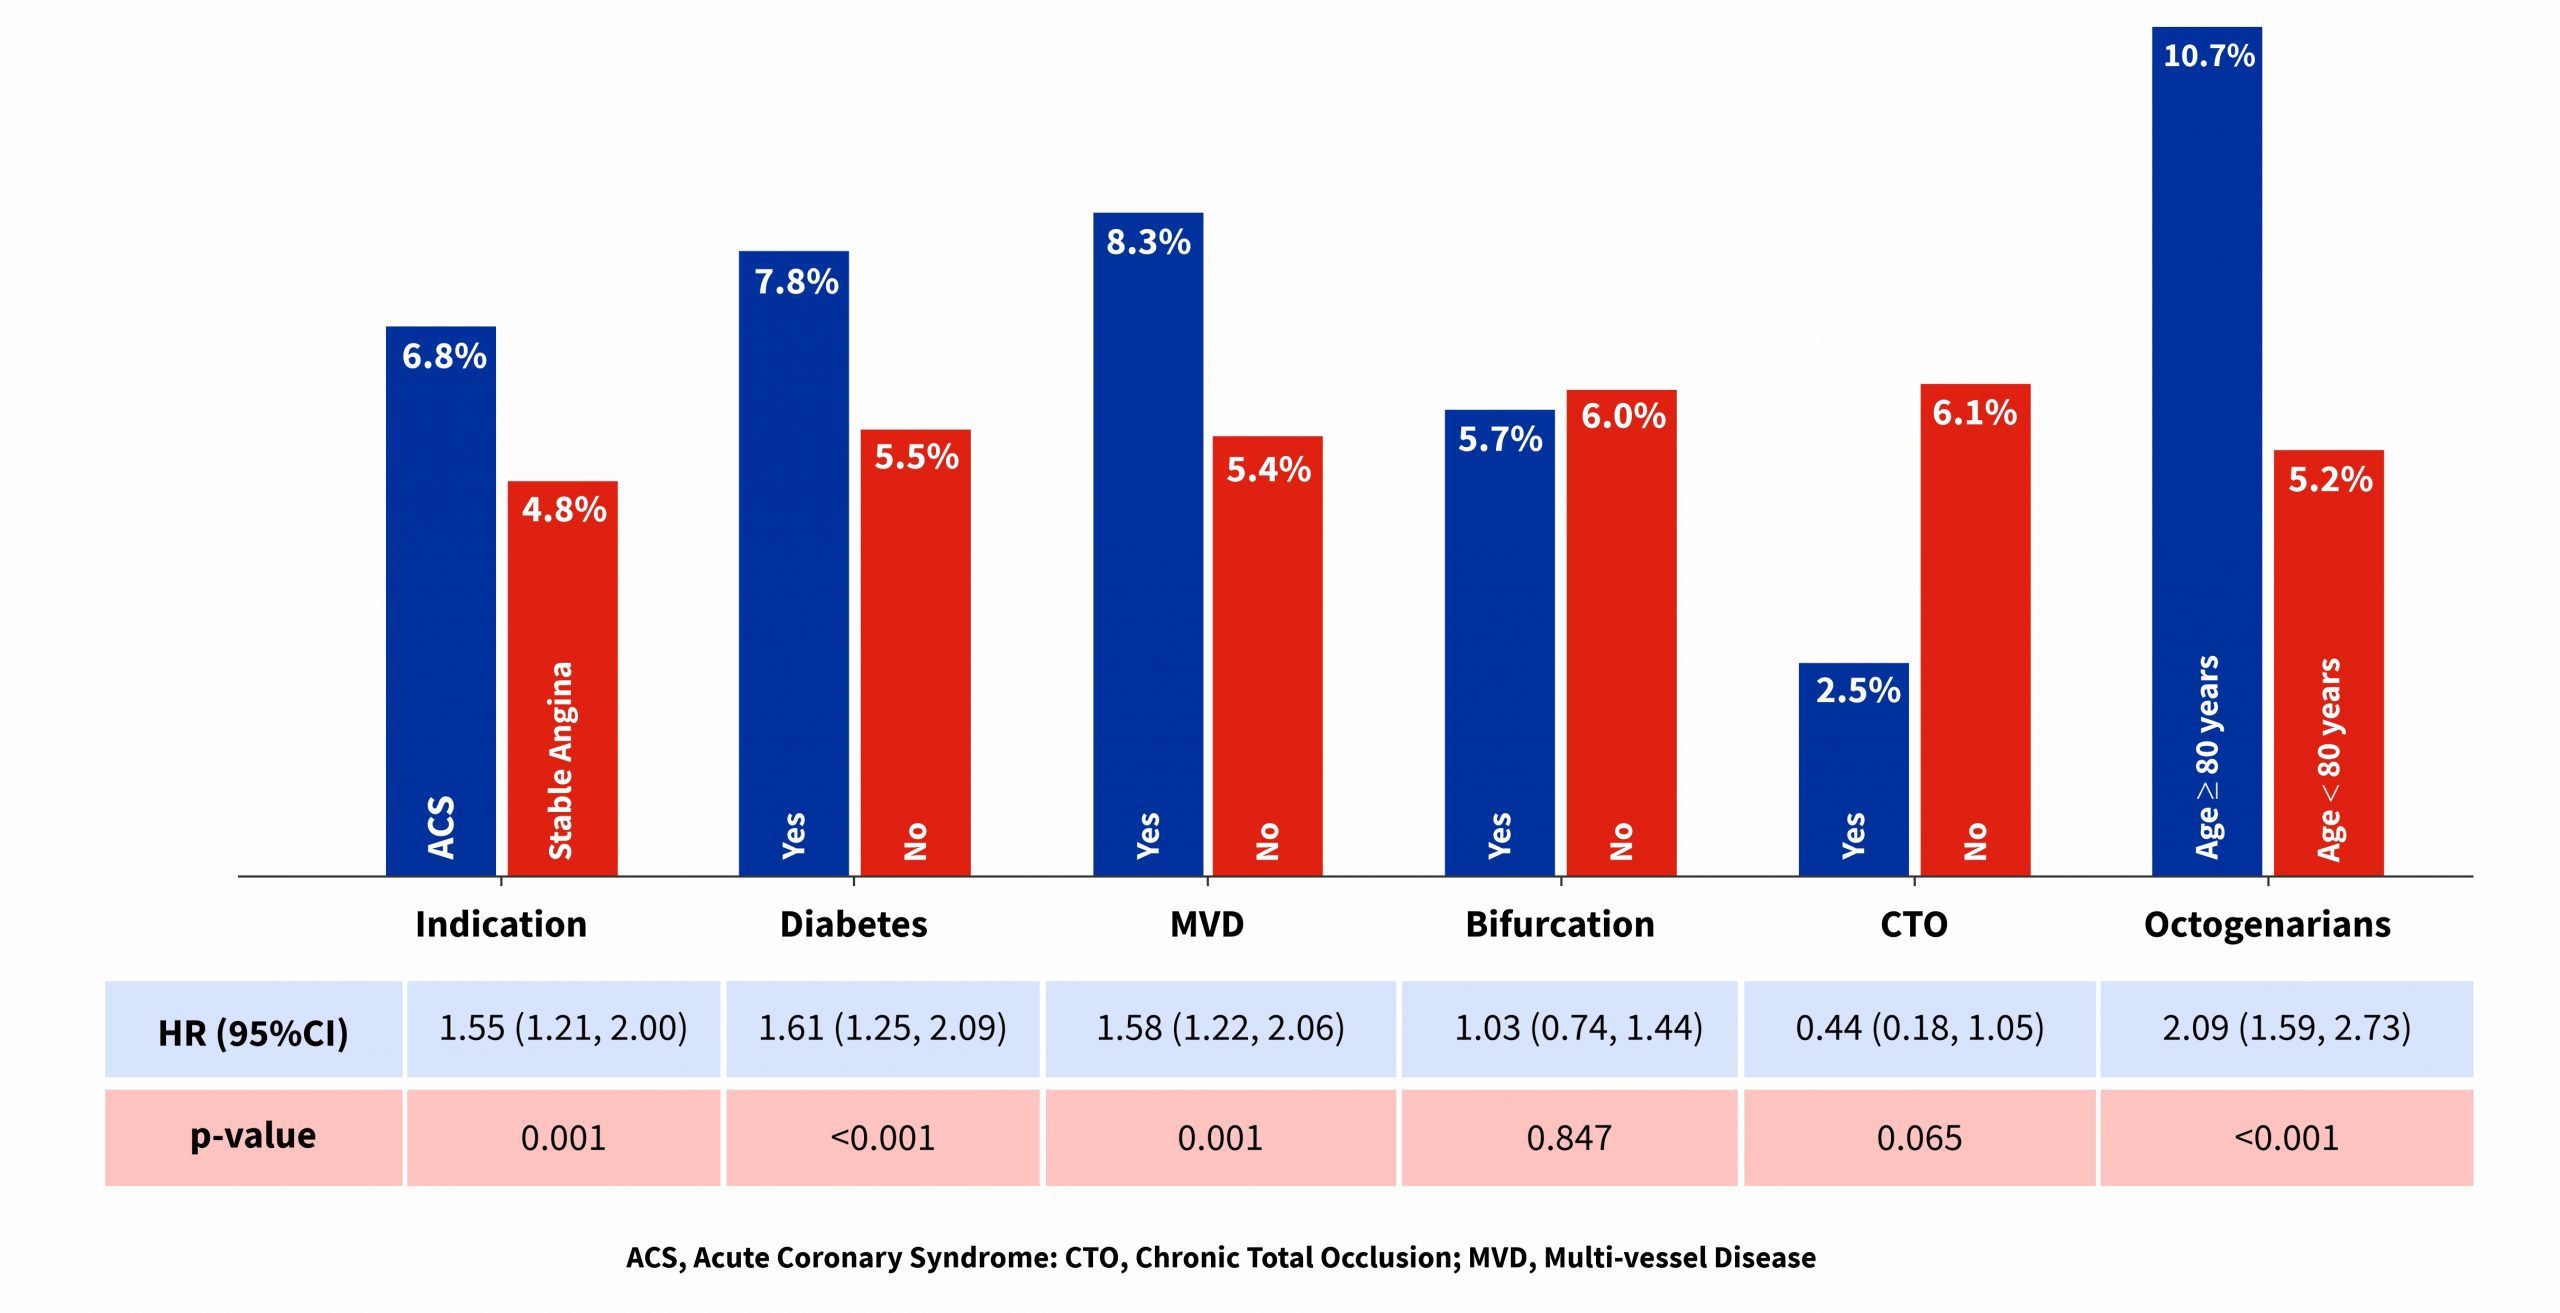
Abbreviation: TLF – Target Lesion Failure, TVF – Target Vessel Failure, HR – Hazard Ratio, CTO – Chronic Total Occlusion, ACS – Acute Coronary Syndrome, MVD – Multi-Vessel Disease, NSTEMI – Non–ST-Elevation Myocardial Infarction, STEMI – ST-Elevation Myocardial Infarction.
Data are presented as frequency (%) or mean ± standard deviation.